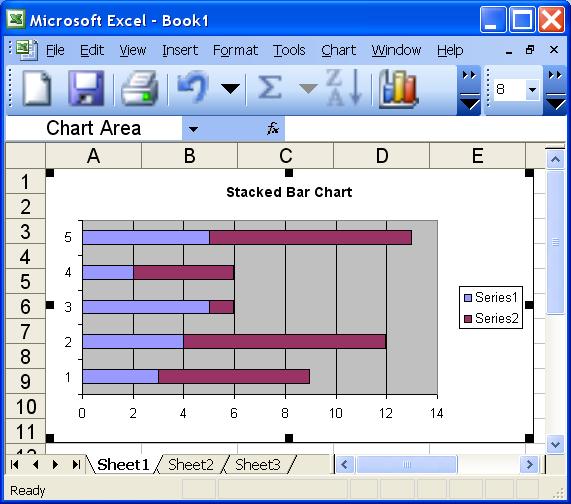
This is a chart that stacks the bars end to end instead of side by side. It is usually used to compare different sets of data while showing the components and total of each set of data.
See also:
- Pie chart
- Line chart
- Area chart
- Chart wizard
- Chart toolbar
- Stacked bar chart
- XY scatter chart
|